July shows rebound in tonnages while rates remain under pressure
All regions showed YoY volume growth in July, led by Asia Pacific (+9%), followed by North America and Central & South America (both +5%), Middle East & South Asia (+4%) and Europe (+3%), while Africa remained stable.

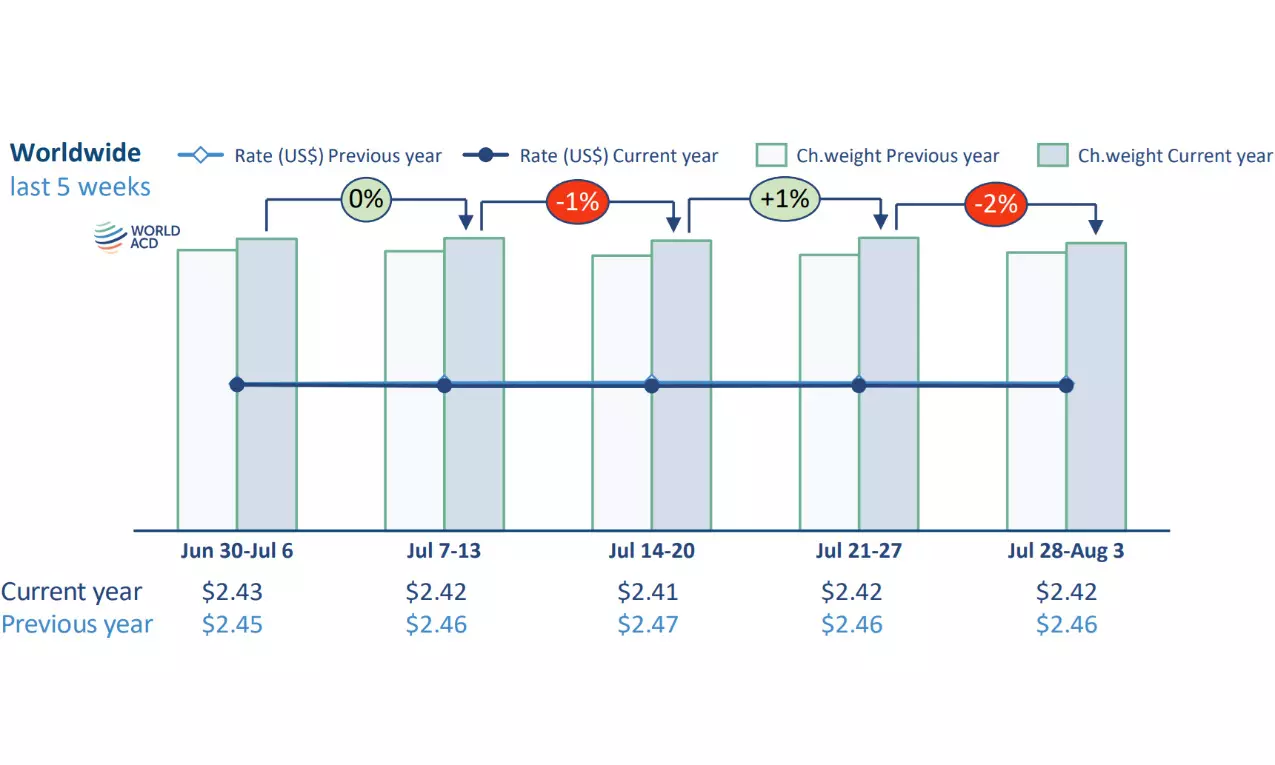
July closed out with a -2% drop in global volume in week 31 (28 July to 3 August) compared to the previous week, continuing a pattern of marginal change from week to week that kept total chargeable weight relatively steady through the month. However, month-on-month growth in tonnages jumped +8%, returning volumes to a year-on-year (YoY) expansion of +6% in July, which is more in line with the YoY growth seen between March and May, after a slowdown to +1% in June. Global pricing barely moved in July, as the YoY volume growth was only slightly higher than the capacity expansion (+5%).
All regions showed YoY volume growth in July, led by Asia Pacific (+9%), followed by North America and Central & South America (both +5%), Middle East & South Asia (+4%) and Europe (+3%), while Africa remained stable. The momentum slowed towards the end of the month. A comparison of the last two weeks with the preceding two weeks (2Wo2W) based on the more than 500,000 weekly transactions covered by WorldACD’s data shows a stable volume in total, with all origin regions experiencing a decline between -1% and -3%, except Europe (+3%).
While week 31 showed no change in global rates on a 2Wo2W basis, and only minor fluctuations out of the main origin regions, global pricing continued to experience pressure in July, dropping -2% year on year, in line with the YoY trend in May and June. Trends differed considerably by origin region, showing a -11% drop from its exceptionally high level last year for Middle East & South Asia (MESA), while the rate decline from Asia Pacific worsened to -4%. Pricing from North America was flat, but rates out of Europe and Africa rose by +5% and +6% respectively.
Notwithstanding a week-on-week (WoW) rise of +1%, spot pricing from the Asia Pacific region to the USA was -15% below 2024 levels, continuing a seven-week run of double-digit annual decline. South Korea and Singapore stood out with WoW drops of -10% and -7% respectively, whereas Japan showed the strongest increase with +7% higher prices.
Rates from China and Hong Kong to the USA inched up +2% WoW, but remained -15% down year on year, while chargeable weight in the sector sank -4% WoW, reversing the previous week’s gain following the post-Typhoon Wipho recovery. This expanded the YoY gap from -6% in week 30 to -10% in week 31.
Traffic from Asia Pacific origins to the USA contracted -6% WoW, led by lower volumes out of Indonesia (-22%), Malaysia (-19%) and Thailand (-17%). Chargeable weight from the region to Europe continued to contract, slipping -4% WoW. South Korea and Taiwan showed the biggest decline with WoW drops of -8%. Spot rates from the region to Europe slipped -1% WoW, with only China and Thailand showing increases (+1% each).
Although chargeable weight moving from North America to Asia Pacific contracted -6% on a 2Wo2W basis, pricing in this trade lane rose +2%. Traffic from North America increased +1% both to Europe and to Central & South America (CSA), with rates climbing +1% and +3% respectively.
Carriers out of Europe, on the other hand, registered small rate declines across all major sectors except CSA during the same two-week period, down -2% to MESA and -1% to North America, Asia Pacific and Africa. This is despite volume growth of +6% to North America, +4% to MESA and +1% to Asia Pacific.
Despite signals that front-loading had largely run its course and widespread hesitation among shippers owing to uncertainty, July produced an increase in global airfreight movement. With tariffs largely falling into place in August, shippers will have better visibility to allow forward planning. Whether or not this can inject new momentum into global flows or if tariffs will slow down traffic remains to be seen.

